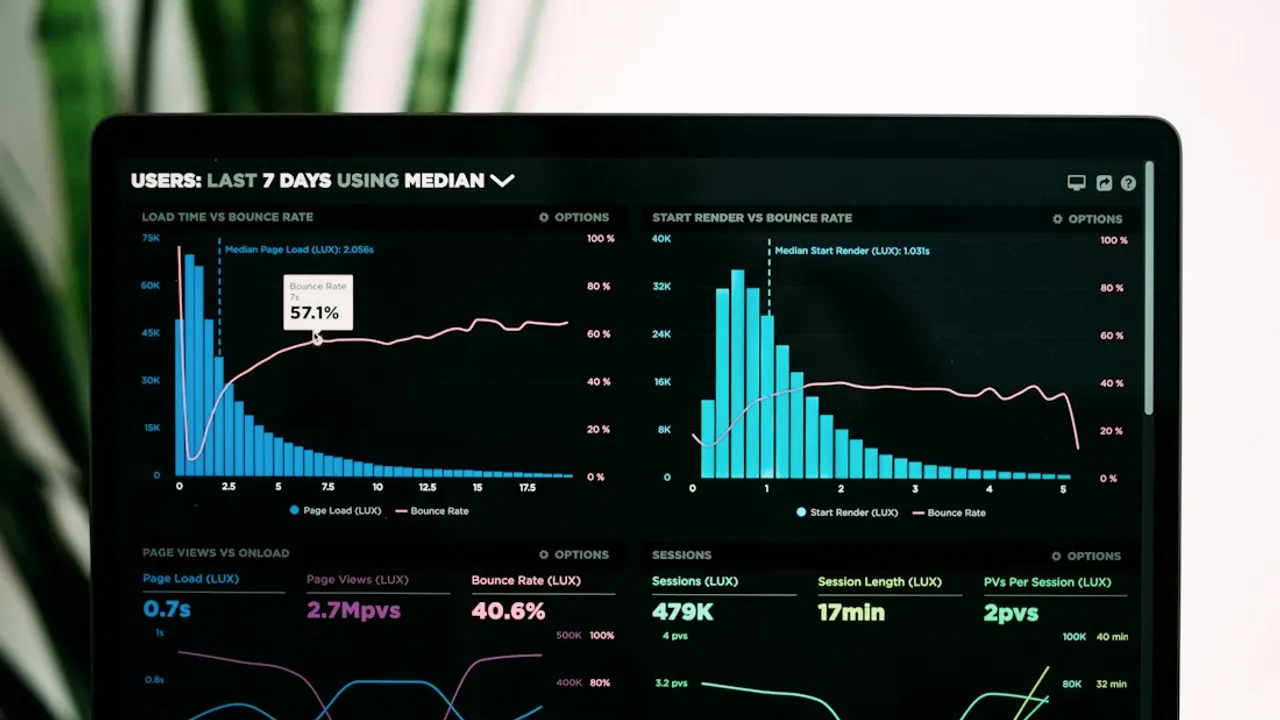
Power BI dashboards that drive decisions, not just display metrics
A beautiful dashboard is not necessarily a useful one. The real question is whether its readers understand what to do next.
Start with the decision, not the chart
The first screen of a management report should reveal exceptions and provide context. Instead of presenting dozens of cards, ask why revenue changed, whether the movement is concentrated in a particular segment, and whether the pattern is seasonal. When the operational question is clear, choosing an appropriate visualization becomes much easier.
The invisible architecture of a trustworthy dashboard
A star schema separates measurable events from descriptive dimensions. Orders, products, customers and dates should relate through explicit keys and well-understood cardinalities. A dashboard can look convincing while still counting transactions twice. Relationships, data quality and the definition of each measure therefore deserve attention before any visual polish.
Build reusable DAX measures
Create one base sales measure and reuse it across reports. A year-on-year comparison only makes sense when the calendar dimension is complete and relationships are correct. A calculation that appears to work on one page should be checked under different filters and levels of detail.
Toplam Satış = SUM(Satislar[NetTutar])
Geçen Yıl = CALCULATE([Toplam Satış], SAMEPERIODLASTYEAR(Takvim[Tarih]))
Değişim % = DIVIDE([Toplam Satış] - [Geçen Yıl], [Geçen Yıl])
Where artificial intelligence actually helps
AI can suggest follow-up questions, draft a narrative around a genuine anomaly and help users discover relevant segments. It cannot repair an incorrect model by writing a persuasive explanation. Verify deterministic measures first, then use generated language as an interpretation layer.
Checklist before going live
For every important KPI, record its formula, owner, refresh schedule and comparison period. Test row-level permissions, verify totals across slicers and confirm the report remains understandable on mobile devices and slower connections. Measure whether readers find the answer, not merely how long they spend looking at the dashboard.
Investigating a decline in sales
When a manager asks why revenue declined, one red KPI tile cannot provide a reliable answer. Start with a clearly named comparison period: the previous week, the same month last year or the budget. Separate units sold, prices, product mix and returns. If revenue drops while order count stays stable, lower average basket value is plausible, but campaigns, inventory and seasonality may also matter. A good dashboard shows the supporting evidence and exposes uncertainty rather than inventing a definitive cause.
Modeling before visualization
Keep sales transactions in a fact table and connect date, product, customer and store dimensions through explicit keys. Validate relationships, especially those that might multiply transactions through a many-to-many join. Test KPI results under product and calendar slicers against independently calculated examples. Show the last successful refresh instead of silently presenting stale data. Explain measure definitions and filtering behavior where users can find them. Visual sophistication cannot compensate for an incorrect semantic model.
Permissions, performance and mobile release
Testing only on a fast developer laptop is insufficient. Verify row-level permissions through restricted accounts so sales representatives cannot see colleagues' customers. Check loading order on slower networks, the legibility of table headings on phones and filter usability. Assign a business owner, formula, source and refresh cadence to each KPI. Keep a previous version available for rollback. The practical success criterion is whether a manager can answer an operational question within a few clear interactions.
Comments
0 real commentsWhen sales totals differ across three reports, I would check filter context and relationships before adjusting visuals. Color is not a data quality fix.
Illustrative reader note and date; not a real comment.✎ Write a comment